📖 Lesson content
Summary
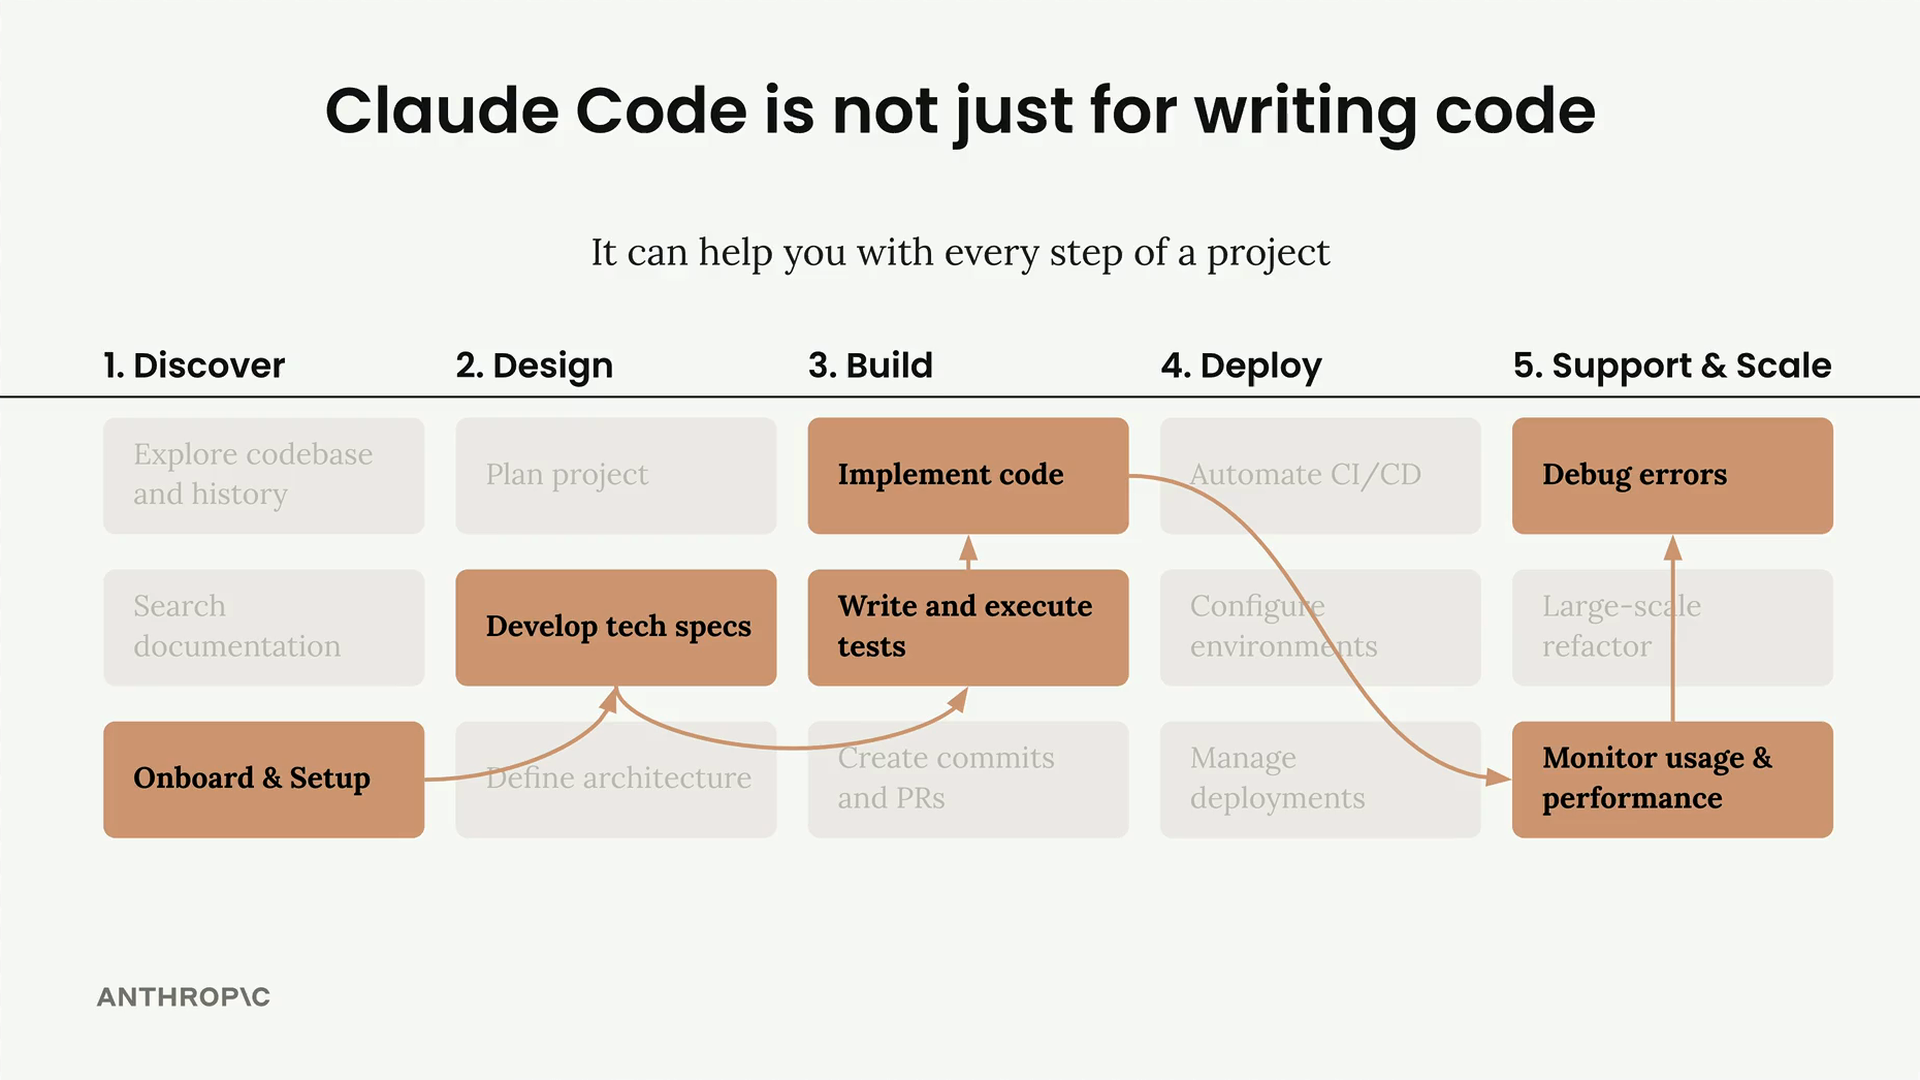
Claude isn't just for writing code in your editor. It can also monitor your production applications and automatically fix errors as they occur. This creates a powerful automated debugging workflow that can catch and resolve issues before they impact your users.
The Problem: Production-Only Errors
One of the most frustrating debugging scenarios is when your application works perfectly in development but fails in production. You might test everything locally, deploy with confidence, only to discover that certain features aren't working in the live environment.
Consider a simple chatbot application that works flawlessly during local testing. You can ask questions, generate spreadsheets with fake data, and everything responds as expected. But when you deploy the same code to AWS Amplify and run identical tests, the spreadsheet generation fails silently - the request goes through, but no data appears.
Traditional Debugging Approach
Typically, you'd need to:
- Hunt through CloudWatch logs to find error messages
- Parse complex error details and stack traces
- Manually debug why the code behaves differently in production
- Fix the issue and redeploy
This process can be time-consuming, especially when dealing with cryptic error messages like "The provided model identifier is invalid" buried in extensive log output.
Automated Error Detection and Fixing
Instead of manual debugging, you can create a GitHub Action that runs automatically every day to monitor your production environment. This workflow delegates the entire debugging process to Claude.
Here's how the automated workflow operates:
- Setup: The GitHub Action checks out your repository, installs dependencies, and sets up Claude
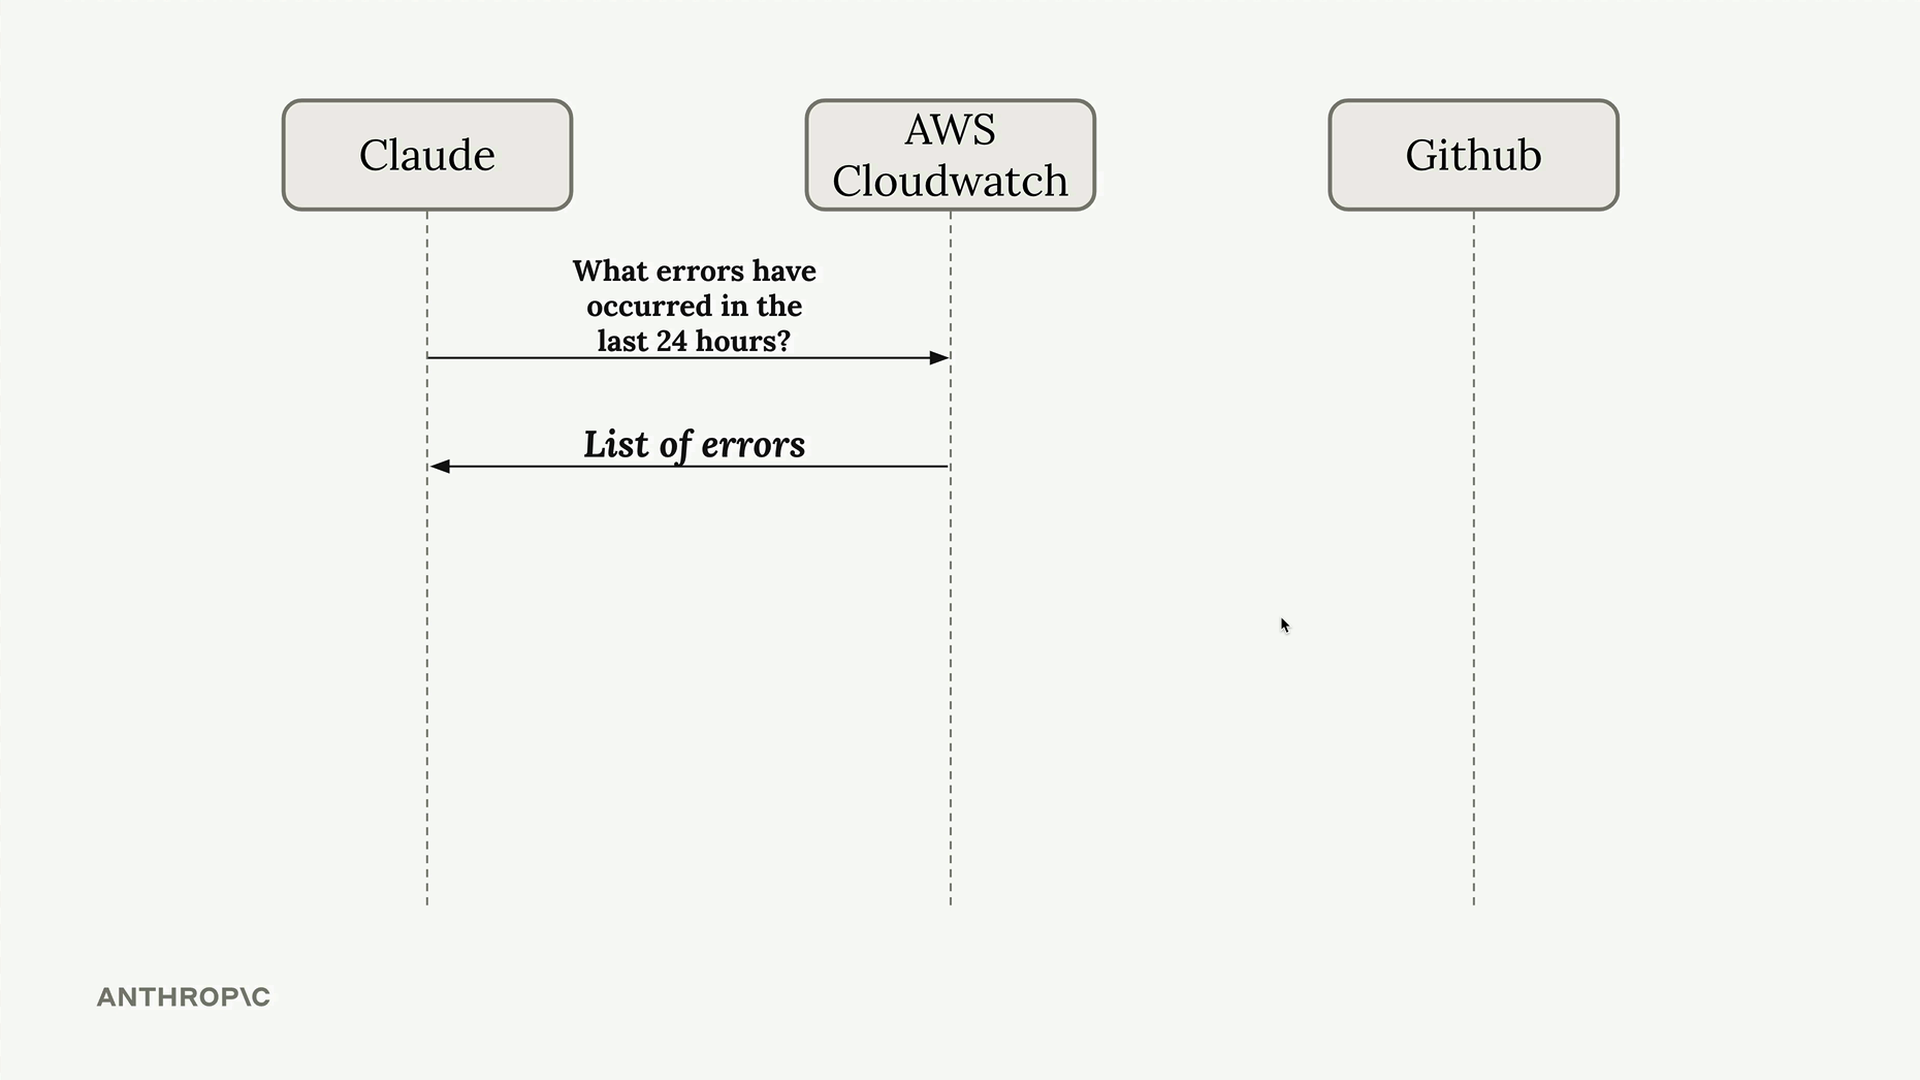
- Log Analysis: Uses AWS CLI to fetch CloudWatch logs from the last 24 hours
- Error Processing: Claude analyzes the logs, removes duplicates, and identifies unique errors
- Fix Implementation: Claude attempts to fix each error by modifying the appropriate code
- Pull Request Creation: Commits the fixes and automatically opens a pull request for review
Real-World Example
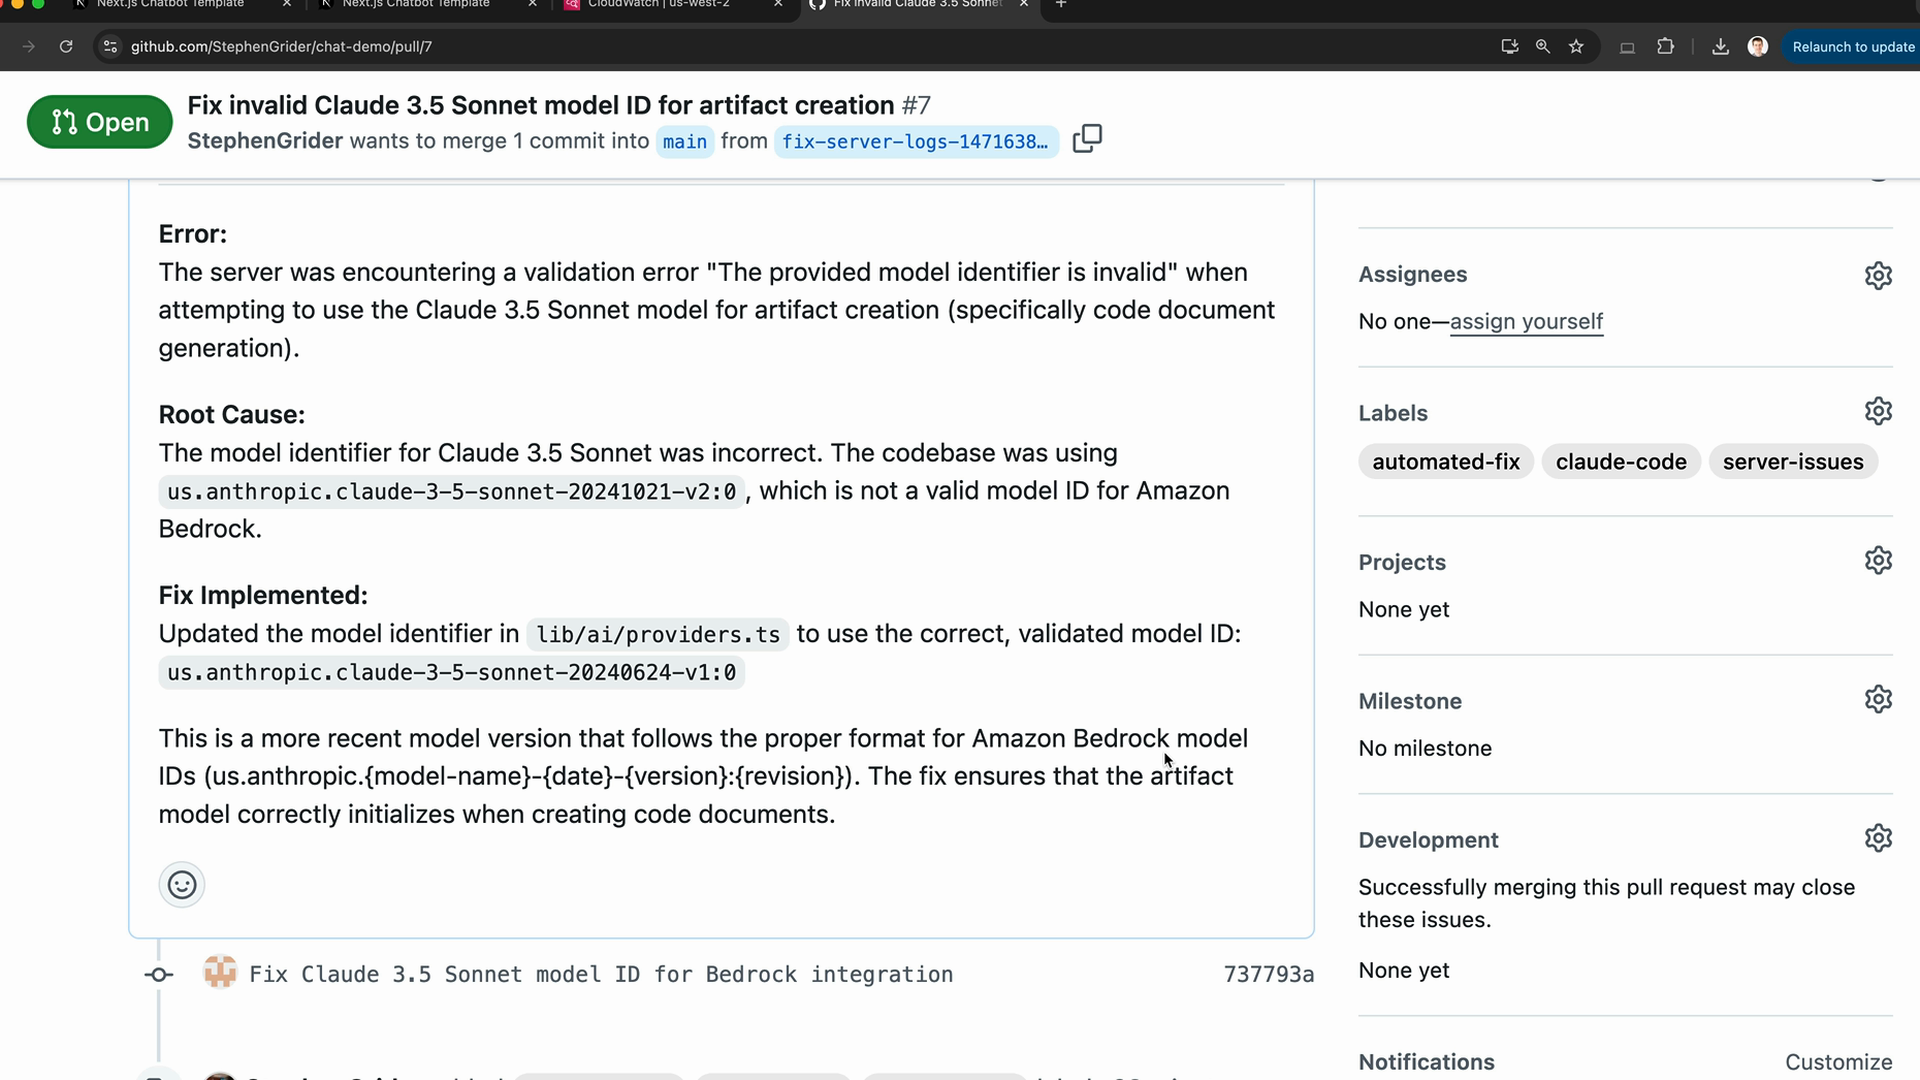
In the chatbot example, Claude discovered that the production environment was using an invalid model identifier. The error occurred because of a typo in the model ID that was only referenced in production configuration.
Claude identified the issue, found the correct model ID format, and updated the configuration file. The fix was then committed with a clear explanation of what went wrong and how it was resolved.
Benefits of Automated Debugging
- Proactive Monitoring: Catches errors before you're even aware they exist
- Time Savings: Eliminates manual log hunting and debugging sessions
- Clear Documentation: Each fix comes with detailed explanations
- Review Process: Pull requests allow you to verify fixes before merging
- Continuous Improvement: Runs automatically to catch new issues as they arise
Implementation Considerations
When setting up automated debugging workflows:
- Configure appropriate AWS permissions for CloudWatch access
- Set reasonable limits on the number of errors processed to stay within context windows
- Include logic to deduplicate similar errors
- Ensure the workflow has proper repository write permissions for creating pull requests
- Consider running the workflow during off-peak hours
This automated approach transforms debugging from a reactive, manual process into a proactive, automated system that keeps your applications running smoothly with minimal intervention.
🔁 Related lessons
- Next: Computer Use
- Previous: Parallelizing Claude Code
- Same section: Overview of Claude Models · Accessing the API · Making a request
- Part of paths: Path C
- Reference docs: Glossary · Skills atlas · By use-case
📚 Source & attribution
- Original Anthropic Academy lesson: https://anthropic.skilljar.com/claude-in-amazon-bedrock/276812
- © 2025 Anthropic. Educational fair-use only.